or, perhaps, the carbon costs of returning to the office?
Author
Philip Khor
Published
August 31, 2023
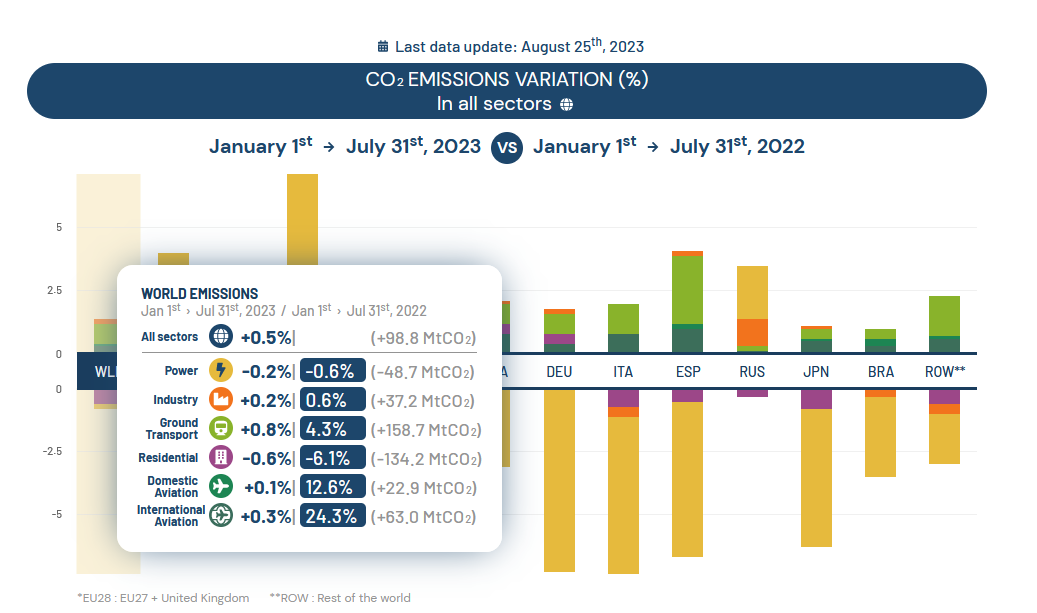
We need to decarbonise our economies ASAP, because global warming induced by human activity is bringing us dangerously close to breaching the limits of adaptability for human civilisation. One project that tracks that effort is a website called Carbon Monitor and boy are we not doing great:
Okay, in fairness, that’s more like mixed reviews. We’re making good progress in power (and somehow the residential sector?) but transport is looking bad, whether ground or air.
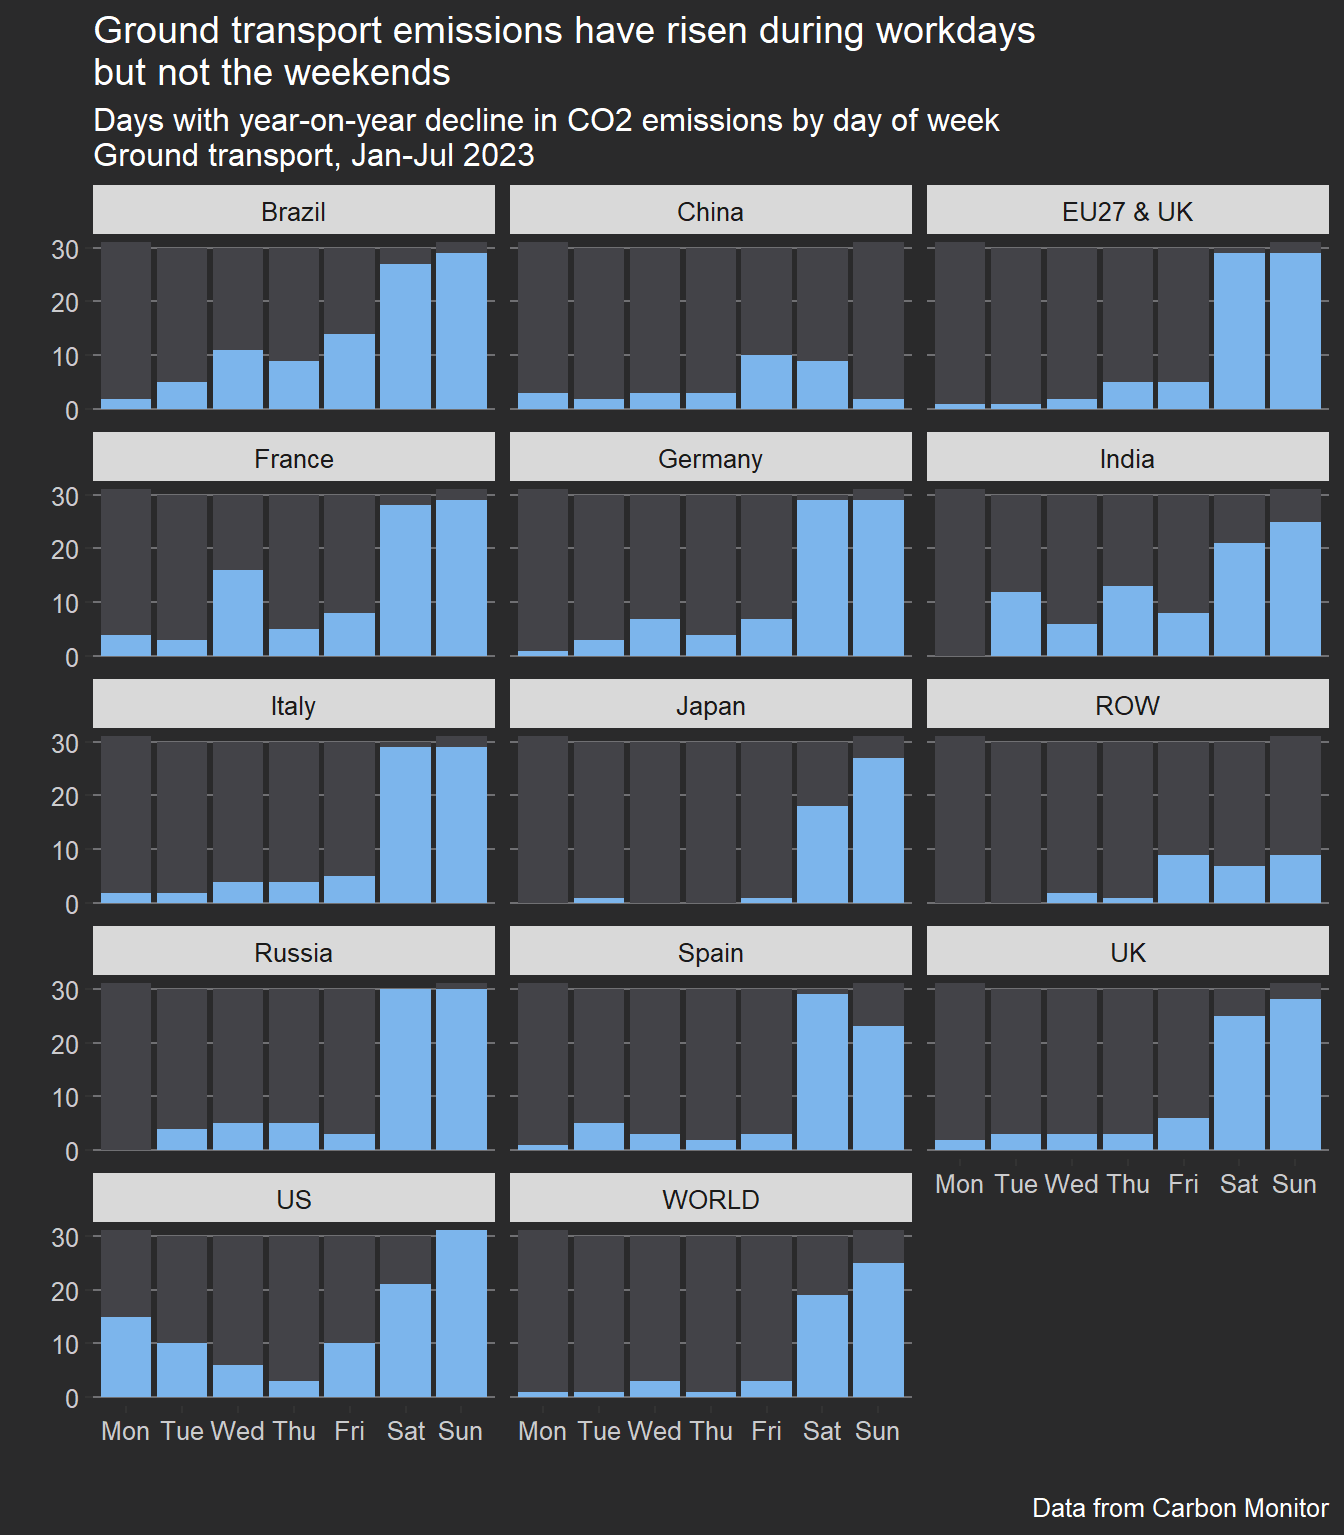
I’m no carbon analyst so I’m not sure what to do with the data, but I notice some interesting seasonality: across the world, emissions spike during the work week, but decline during weekends.
More interestingly, for ground transport, emissions consistently increase year-on-year during weekdays, and consistently decrease year-on-year during weekends:
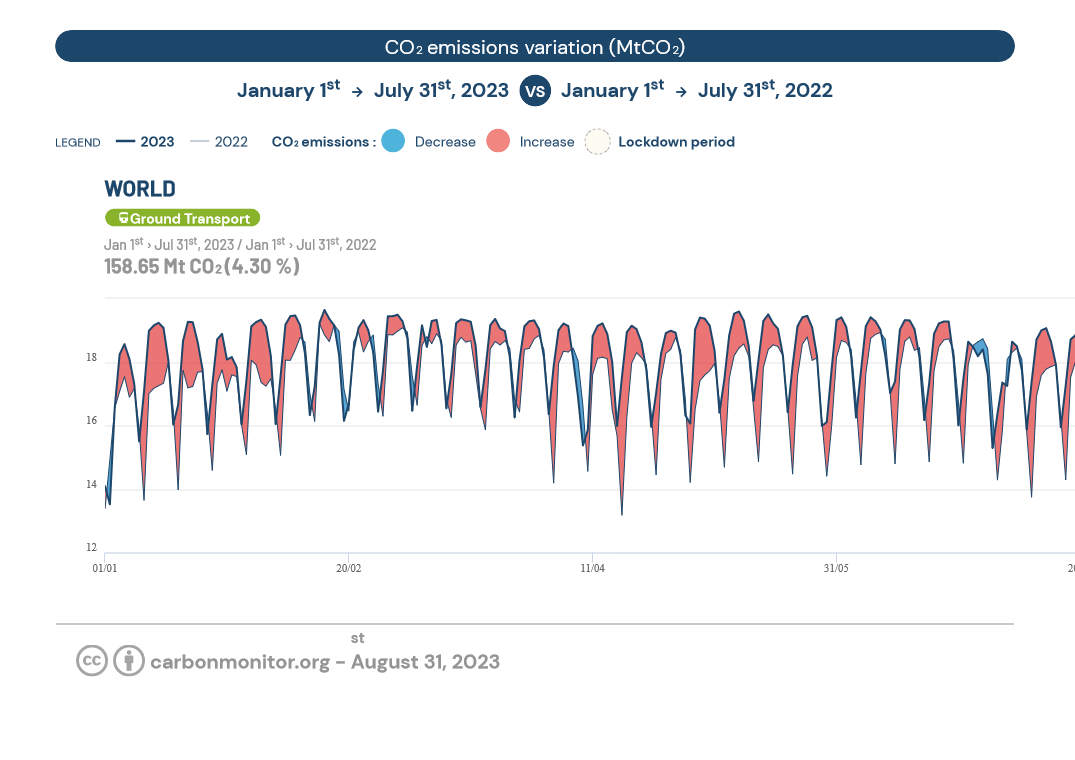
Okay, not really so for the world, but have a look at the US and the EU:
and in case this was a fluke, I plotted the data by day of week:
Show the code
library(readr)library(lubridate)library(dplyr)library(tidyr)library(ggplot2)library(here)library(ggthemes)carbon <-read_csv(here("data", "carbonmonitor-global_datas_2023-08-31.csv"), col_types =cols(date =col_date(format ="%d/%m/%Y")))carbon_plus1 <- carbon |>mutate(date = date + lubridate::years(1))carbon |>left_join(carbon_plus1 |>select(-timestamp),by =c("country", "date", "sector")) |>drop_na(value.y) |>mutate(diff = value.x - value.y,day_of_week =wday(date, label =TRUE, week_start =1),reduce = diff <0 ) |>filter(year(date) ==2023, sector =="Ground Transport") |>ggplot(aes(x = day_of_week, fill = reduce)) +geom_bar() +facet_wrap(vars(country), ncol =3) +labs(x ="", y ="", title ="Ground transport emissions have risen during workdays \nbut not the weekends", subtitle ="Days with year-on-year decline in CO2 emissions by day of week\nGround transport, Jan-Jul 2023",caption ="Data from Carbon Monitor") +scale_fill_hc(limits =c(TRUE, FALSE)) +theme_hc(style ="darkunica") +theme(legend.position ="bottom", axis.text =element_text(colour ="#cbcbcd")) +guides(fill =FALSE)
It’s nice to see weekend emissions fall somewhat: perhaps rising EV adoption is finally having an effect? As for consistently higher weekday emissions, I think it may be reflective of the reversal of flexible work arrangements to in-person work in spite of the significant health risks that continue to be posed by Covid-19, and it looks like there are significant climate costs associated with this unfortunate phenomena which more than offset the significant progress that has been made in decarbonising our energy sources.
.png)
.png)
.png)