LSEG launched its unified ESG Score in March 2026. This is what it actually built, why the methodology was constrained before it began, and what the simplification costs.
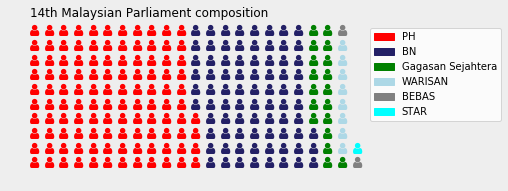
When your country channels people-pleasing tendencies into a governance strategy
On ESG ratings, Berg et al., the welfare function nobody specified, and why unstable inter-rater correlation is not a scandal.
Transition relief narrows the scope of IFRS S1 to climate, but it does not replace it. You cannot faithfully apply IFRS S2 without S1 concepts.
Sustainability-related management commentary that does not communicate tradeoffs is not decision-useful. IFRS S1 is entirely comfortable letting boards confess their own…
Why I refuse PPE abandonment—and why the logic of reprieve, though biologically sound, collapses under asymptomatic spread.
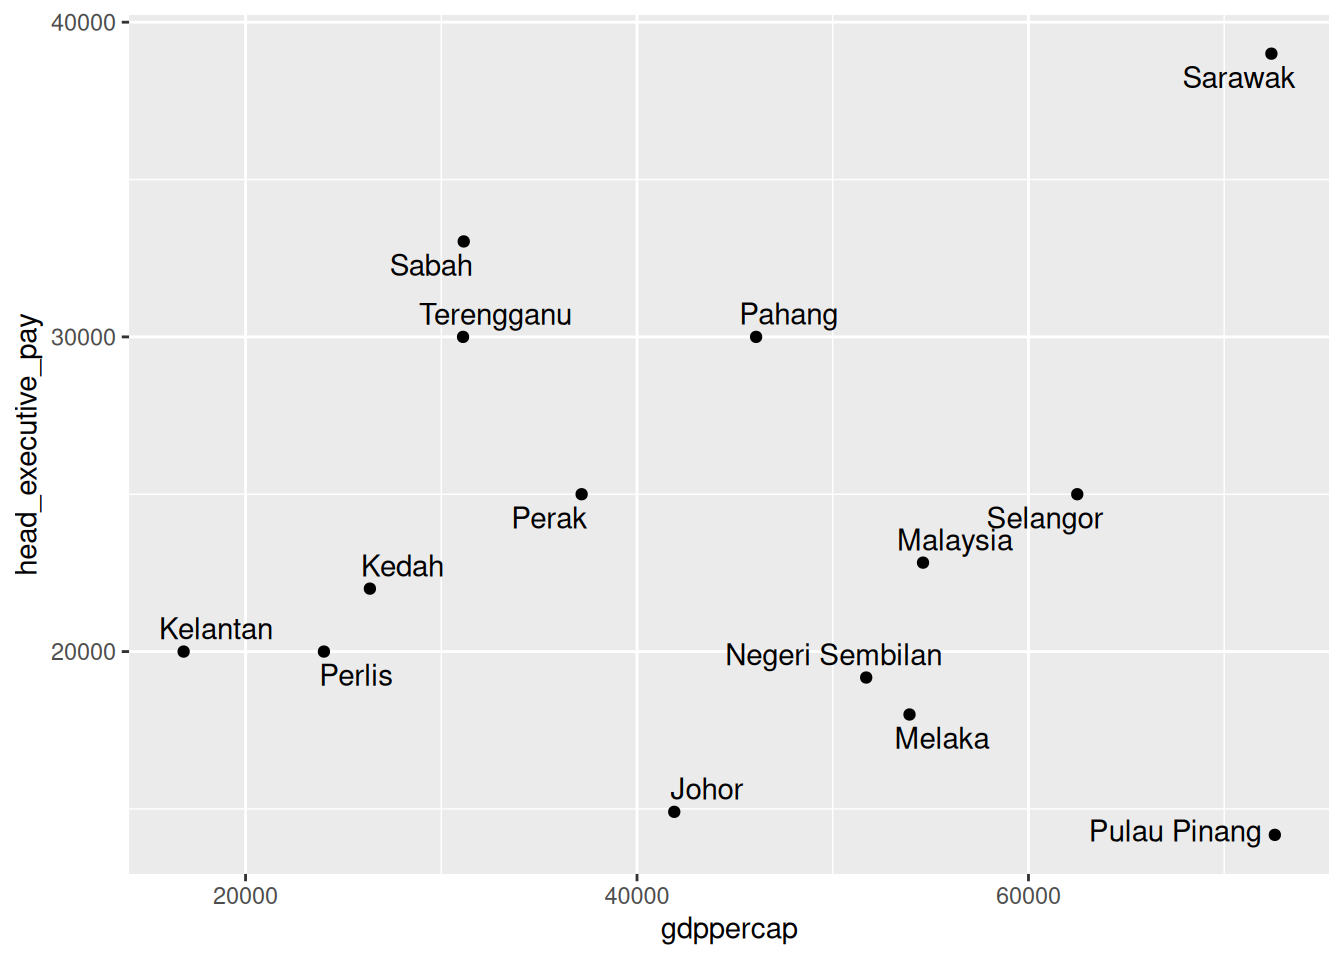
We compare how FTSE Russell and S&P Global assess various aspects of fair pay within their ESG ratings methodologies. By highlighting the key differences in their approaches…
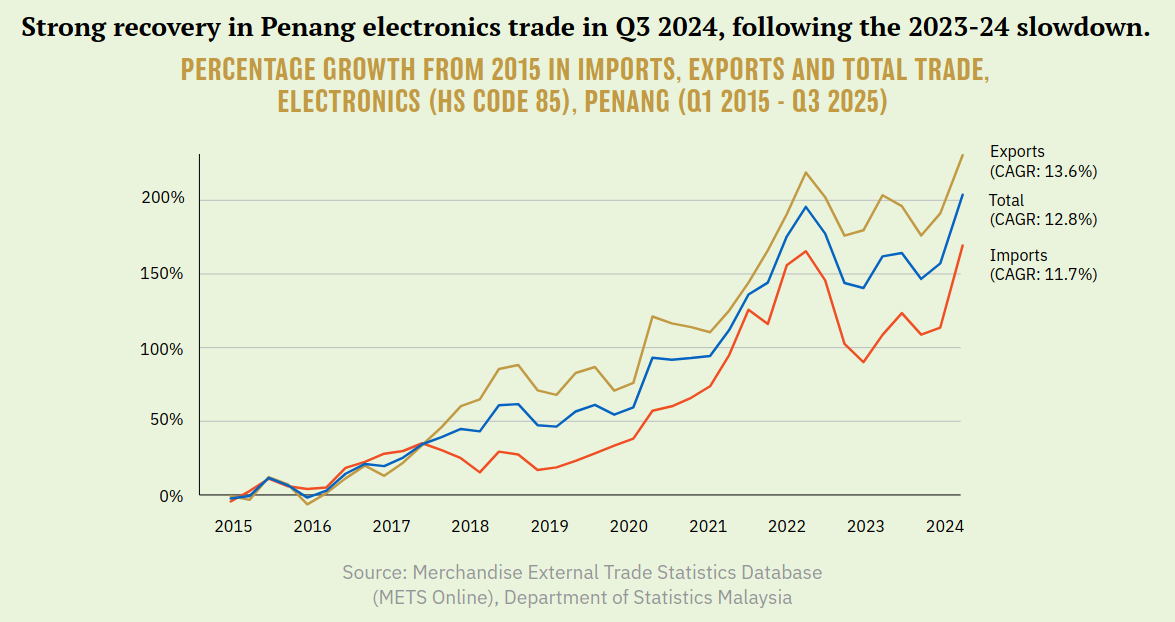
Navigating global trends and industrial upgrading
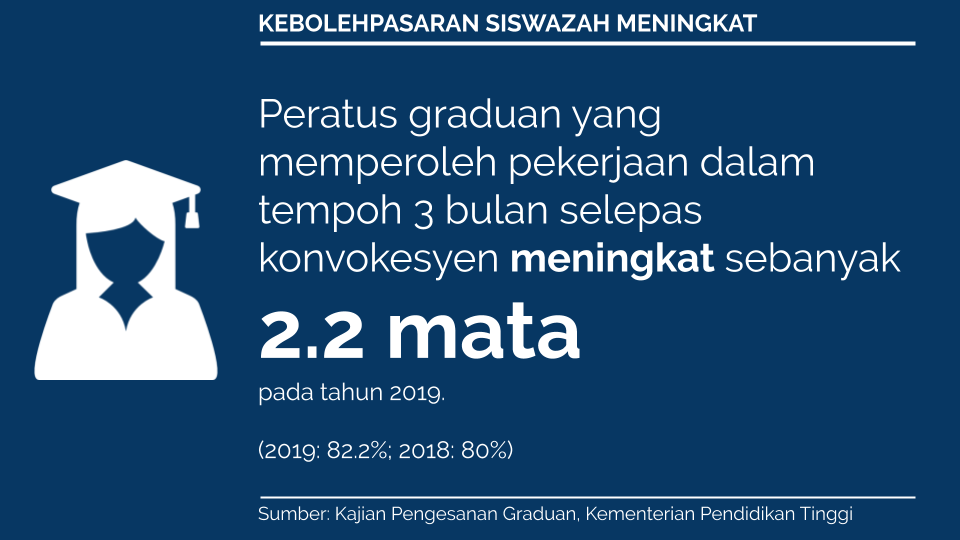
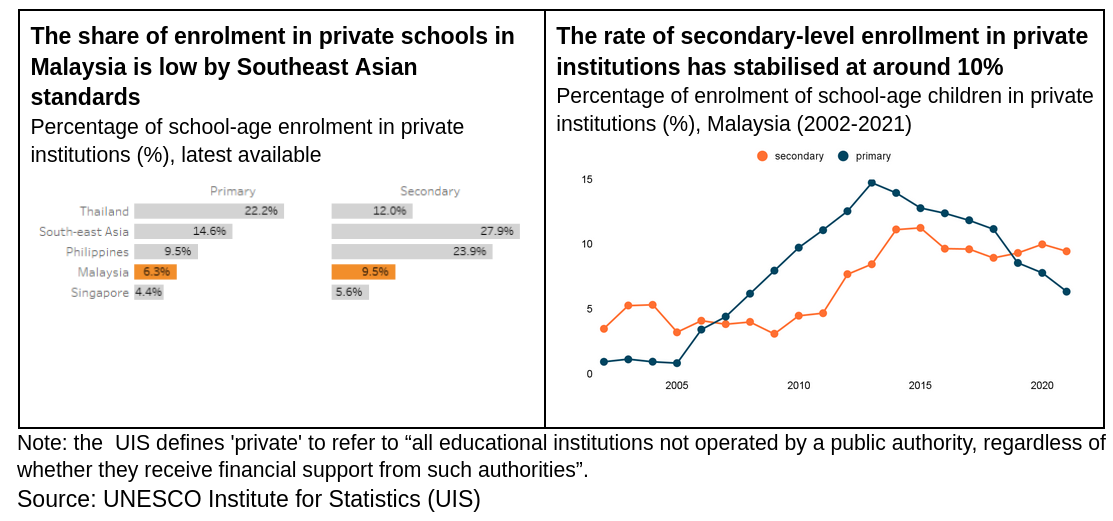
Penang’s education scene is changing rapidly. While Malaysia’s private school enrollment remains modest compared to the region, it is seeing a concerning shift.
Panasnya
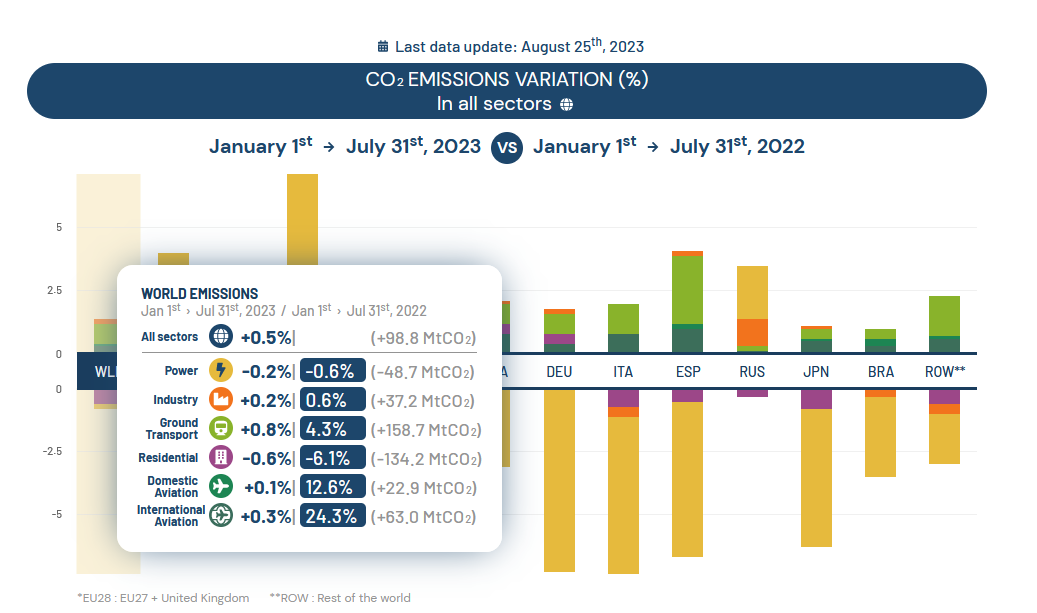
or, perhaps, the carbon costs of returning to the office?
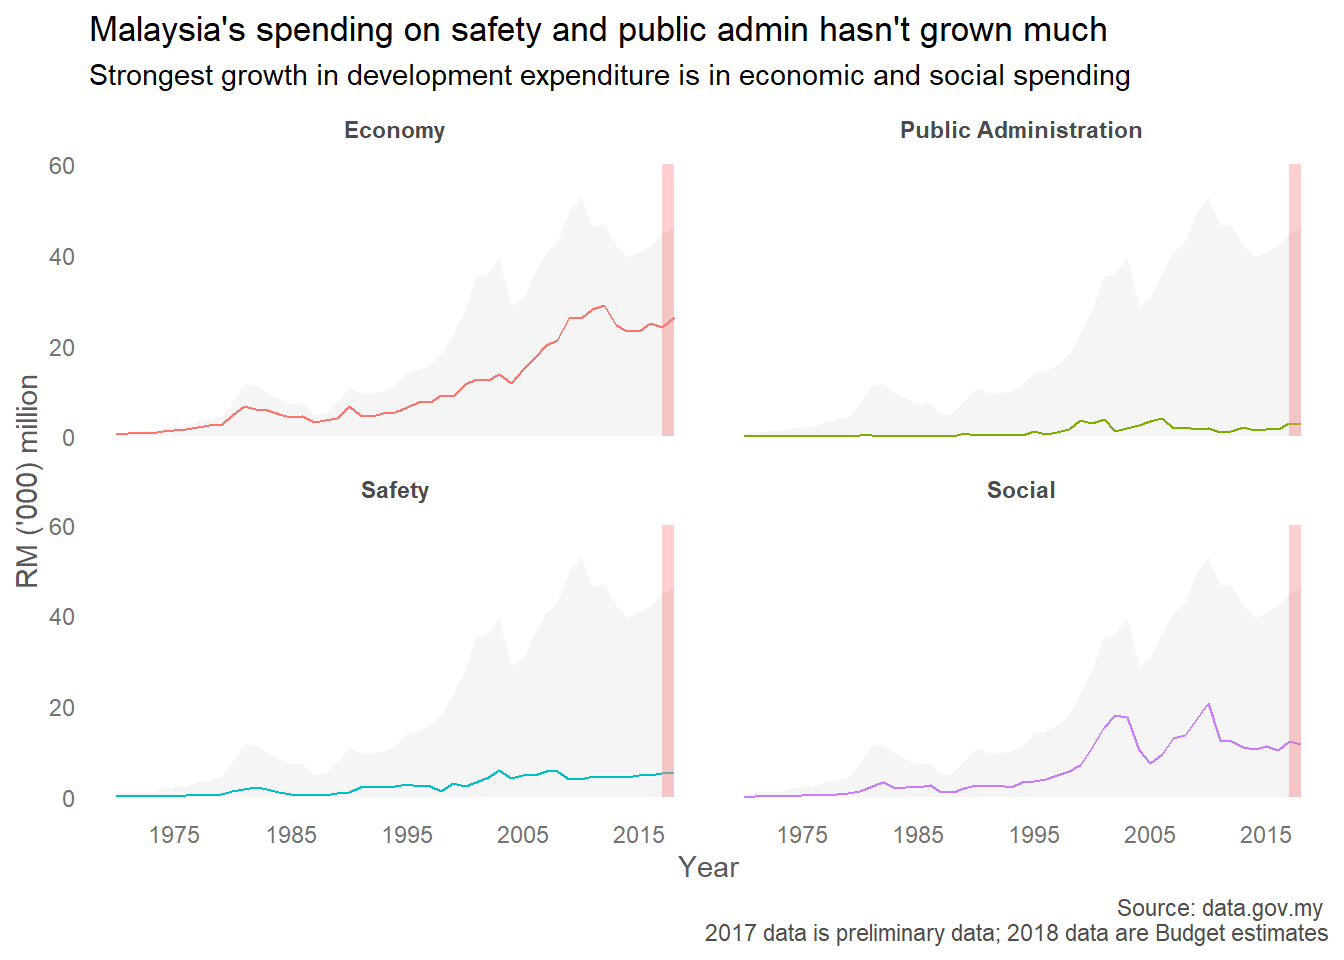
One of my pet peeves is to see people advocate for tax rebates when they should know better.
ggplot2
httr


.jpg)