Not sure how I landed up browsing through Julia for Data Science and Julia Data Science this Saturday evening. Julia is a fascinating language, but I think the learning curve is a bit much for me. Tried making a simple line chart and it’s … pretty hard, although the syntax is quite interesting …
begin
    using CSV, DataFrames
    using Downloads: download
    URL_DATA = "https://storage.dosm.gov.my/cpi/cpi_2d.csv"
    download(URL_DATA, "cpi_2d.csv")
    df = CSV.read("cpi_2d.csv", DataFrame)
end
begin
using DataFramesMeta
using AlgebraOfGraphics
using CairoMakie
using Dates: Year
@rsubset! df :division == "overall"
enddat = @chain df begin
@select :date :lagged_index = :index
@rtransform :date = :date + Year(1)
rightjoin(df; on = :date)
@rtransform :yoy = :index / :lagged_index - 1
dropmissing(:yoy)
endbegin
set_aog_theme!()
plt = data(dat) * mapping(:date, :yoy)
layers = visual(Scatter) + visual(Lines)
draw(
plt * layers,
axis = (
ytickformat = "{:.0%}",
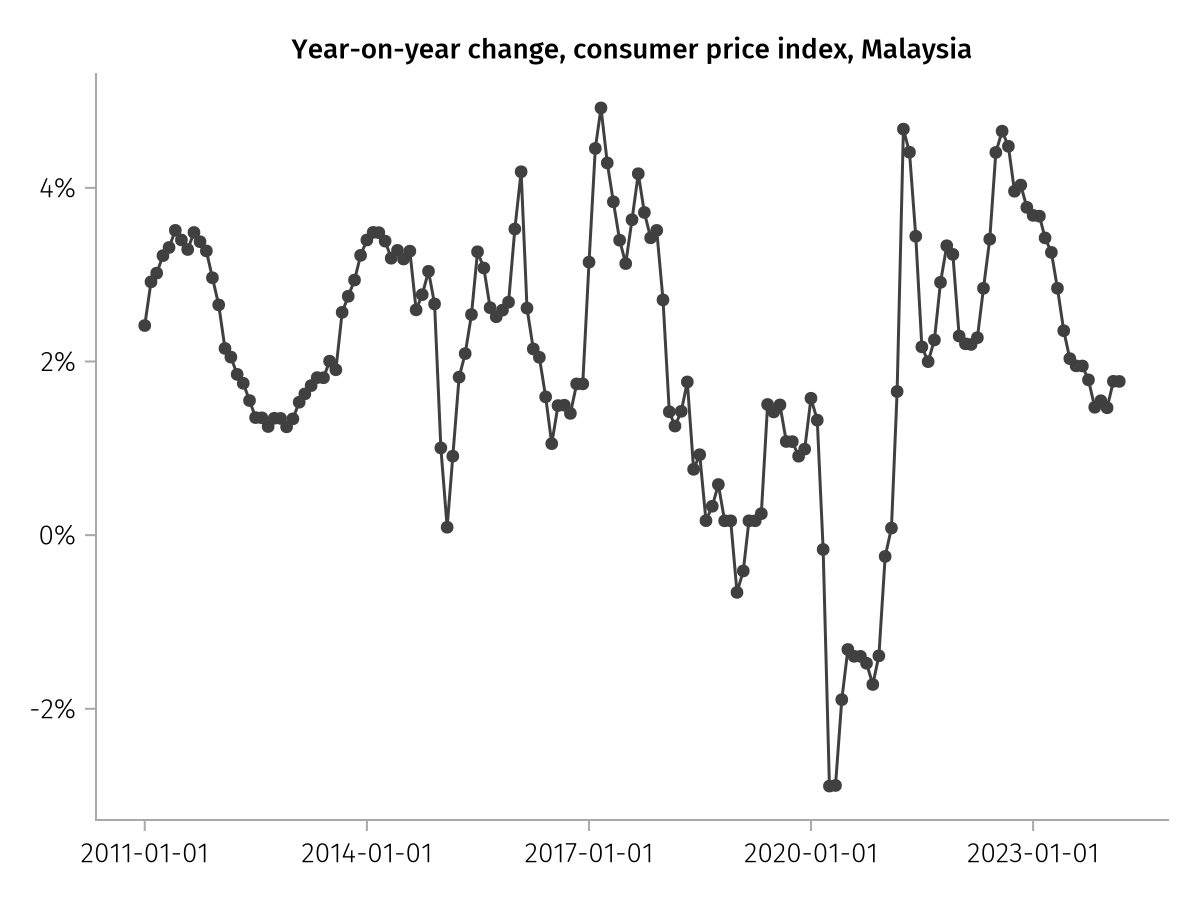
title = "Year-on-year change, consumer price index, Malaysia",
xlabel = "",
ylabel = "")
)
end